One of the Ministry of Transportation and Infrastructure’s main goals is to reduce greenhouse gas emissions to help achieve the province’s climate action goals. The ministry has translated this goal into several objectives and strategies, including:
- increasing the use of transit, cycling, and other alternative modes of transportation; and
- reducing the use of single-occupant vehicles.
Another important goal is to reduce traffic congestion.
To assess its success, the ministry has one main measurement that it monitors: annual public transit ridership in British Columbia.
Ridership
Transit ridership in this definition means the number of transit rides taken in a year. Transit ridership is one of the simplest measurements to monitor, and is commonly used to assess transit success across public transportation agencies.
The challenge is that transit ridership can increase without automobile use decreasing; therefore, the ultimate goals of reducing congestion and greenhouse gas emissions may not be achieved.
This can occur because of the phenomenon known as “induced demand.” Induced demand is when people increase their total travel because additional transit options are made available to them. Take the following hypothetical example:
Mr. Smith habitually takes the bus to get to and from work every day. Let’s assume that he does not have a car and cannot get to the library by bus. When a new bus service to the library is introduced, he starts to make two extra trips each day. Mr. Smith’s transit ridership doubled, but there would be no related reduction in traffic congestion or greenhouse gas emissions because this is a new trip that he was not making before.
On the other hand, if Mr. Smith did have a car and he used to drive to the library, switching from car to bus for that trip means his transit ride would contribute to reduced traffic congestion and greenhouse gas emissions.
Unfortunately, we cannot know which of these scenarios is accurate just by measuring the increase in transit trips. Other measurements are necessary to tell if traffic congestion and greenhouse gas emissions are being reduced.
Mode Share
Another measurement that transportation agencies use to monitor the reduction in the use of single-occupant vehicles is “transit mode share.” Transit mode share refers to the proportion of the total trips people take by transit in a given area . For example, in Victoria, the transit mode share was last measured by the Capital Regional District (CRD) in its travel survey in 2011 and it was 6.3 percent (see Figure 16), which was a slight decrease from the mode share of 6.4 percent in 2006. The Provincial Transit Plan includes targets for increasing transit mode share by 2020. (See Figure 3) However, BC Transit and the Ministry of Transportation and Infrastructure do not include mode share targets in their respective service plans.
Mode share is typically calculated by estimating the total number of trips people take within a region and dividing this by the number of trips taken by each mode of travel. The most reliable method to measure mode share is through a large-scale population survey.
Large-scale surveys are costly; therefore, mode share is not measured very frequently. In the CRD, the main travel survey is conducted every five years. In the rest of BC Transit’s service areas, mode share is measured through the national census every five years. However, the census only captures how people travel to work, whereas the CRD’s study includes all trips made in a day. In the CRD, trips for travelling to work made up only 16 percent of the total trips made in a day.
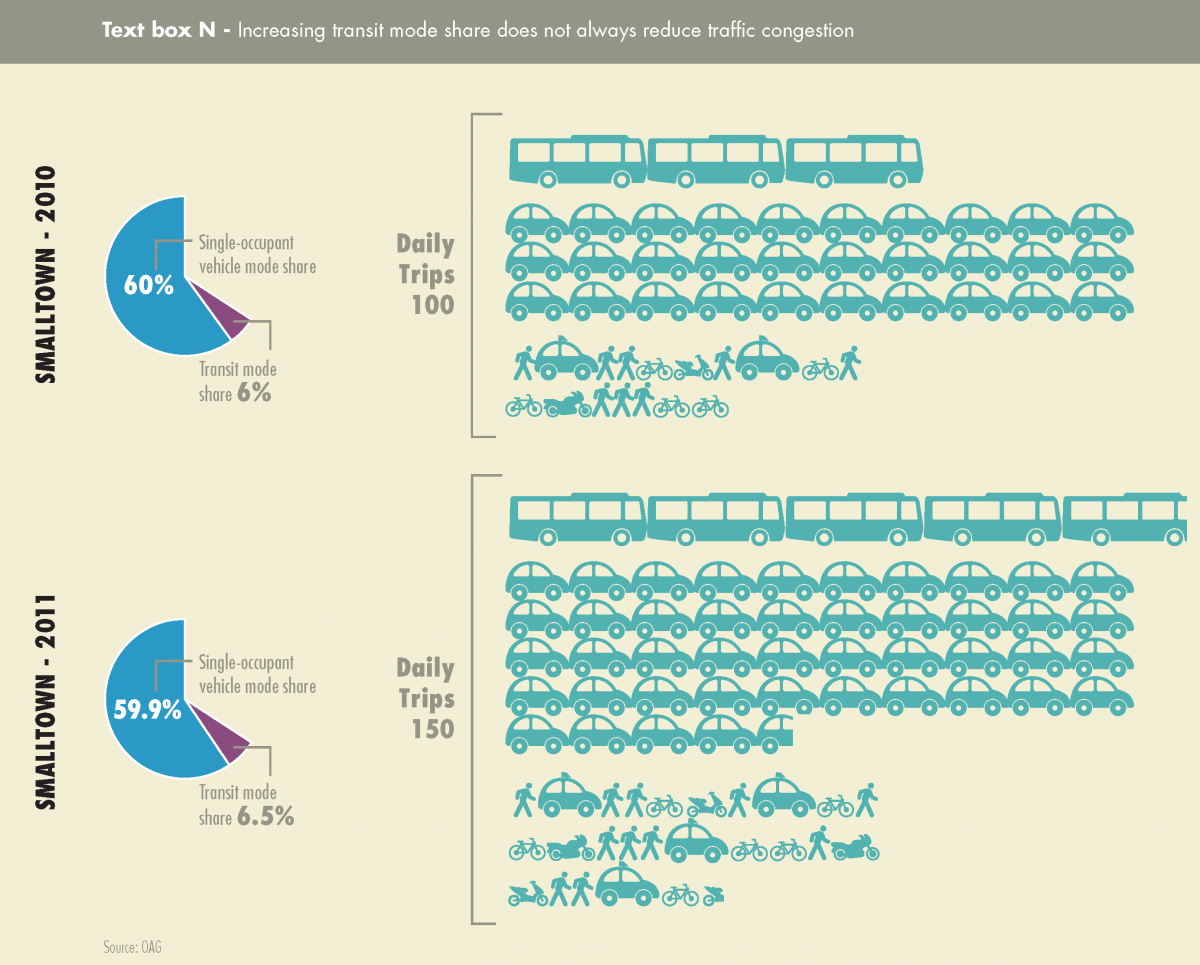
An additional measurement challenge is that transit mode share can increase, but if total trip length and/or the number of total trips also increases, there may not be a reduction in greenhouse gas emissions. Take the following hypothetical example (click image to enlarge):
In Smalltown in 2010, the transit mode share was 6 percent and the single-occupant vehicle share was 60 percent. If the people of Smalltown took 100 trips a day, this means that six trips were taken by transit and 60 trips by single-occupant vehicle. (The rest of the trips were made by walking, taxi ride, etc.)
In 2011, the Smalltown transit mode share increased to 6.5 percent and the single-occupant vehicle share decreased to 59.5 percent. However, the total number of trips also increased to 150 per day. This means that 9.75 trips were taken by transit and 89.25 trips were taken by single-occupancy vehicle. With this increase in the total number of trips, neither traffic congestion nor greenhouse gas emissions were reduced, despite the improvement in transit mode share.