BC Transit’s customer satisfaction survey results (2013) show that province-wide, 53 percent of people surveyed commute to work or school and have a vehicle available for these trips if they need it. To reduce greenhouse gas emissions, transit promoters could target these people to convince them to make that choice of transit over vehicle use.
Figure 17-a - Potential transit commuters in B.C. (click image to enlarge)
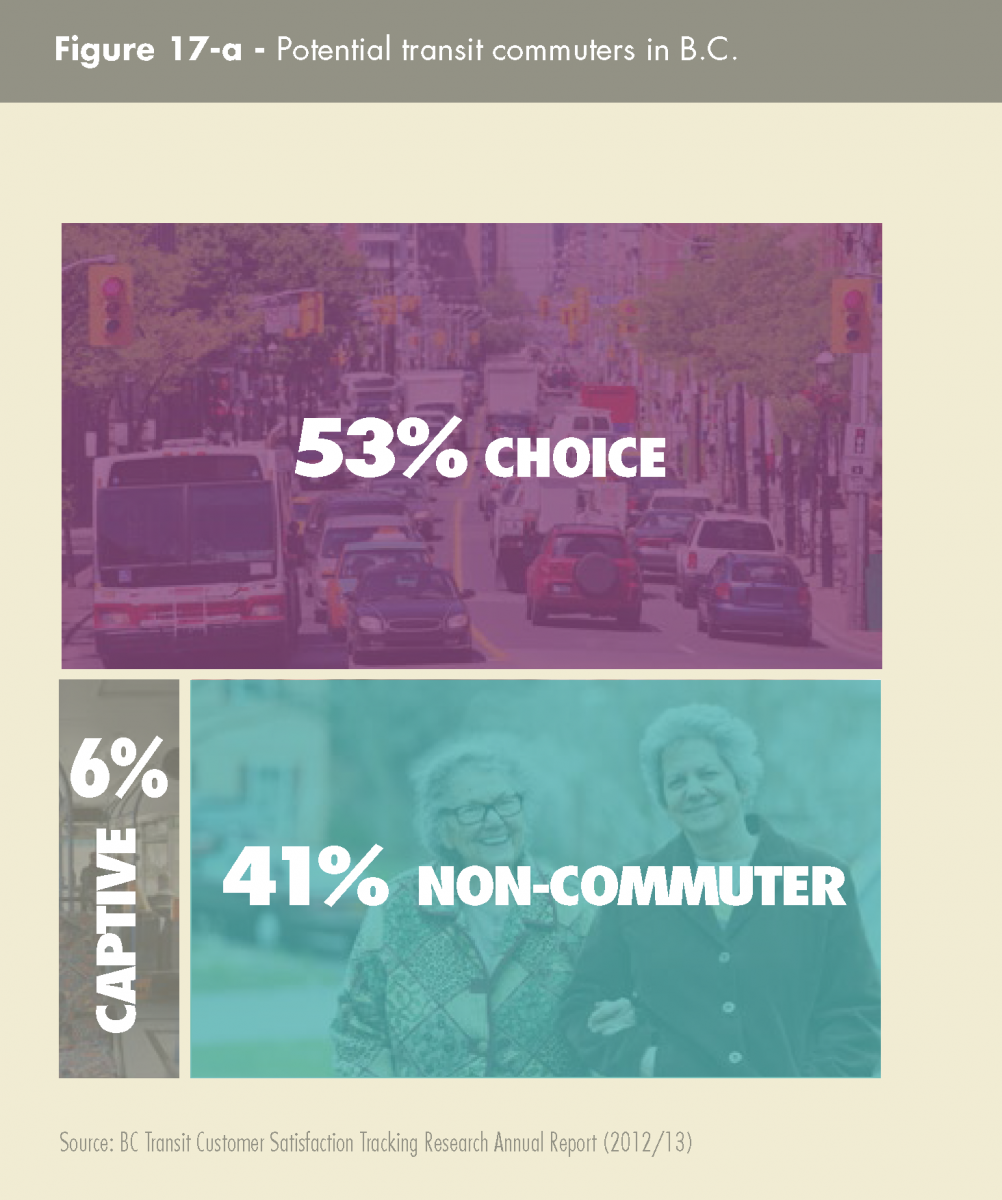
However, not everyone has the option of giving up their vehicle for their commute. Over one-third of the commuters surveyed reported that their employment requires them to use their own vehicle. The remaining two-thirds of “choice” commuters however, would be a potential target group for BC Transit to try to convert.
Potential “captive” commuter population
On average across British Columbia, 6 percent of people surveyed by BC Transit in 2012/13 do not have a vehicle available to them for work or school commuting. This largely comprises the “captive” transit rider group, although some of these people might commute by walking, cycling, or carpooling rather than transit. The highest proportion of this group, almost one-third, is in the 15-24 year old age bracket (29 percent in 2012).
Victoria and Whistler have a higher proportion of the population without access to a vehicle for commuting to work or school, with 10-11 percent in this “captive” population group. Connected with this trend is that Victorians, Whistlerites and those living in Tier 3 communities have fewer cars per household (1.8 or 1.9 cars) than others in the province (2 cars).
Potential “choice” and “captive” populations in the Capital Regional District – beyond commuting
Looking beyond commuting travel and considering all trips taken, the picture is quite different. Within the Capital Regional District area, according to the Origin and Destination Study 2011, just over one-third of all non-vehicle trips were taken by “choice”, in that a vehicle was available to the traveler. For the remaining two-thirds, a vehicle was not available, so that traveler was “captive” to transit, walking or cycling.
This suggests that there is a fairly large pool of potential “captive” population that could ride transit in Victoria. It helps to explain that 11 percent of Victoria’s survey respondents take transit for their non-commuting travel, and another 22 percent cycle, walk or use a variety of transportation modes. Future growth would likely have to come from choice riders.
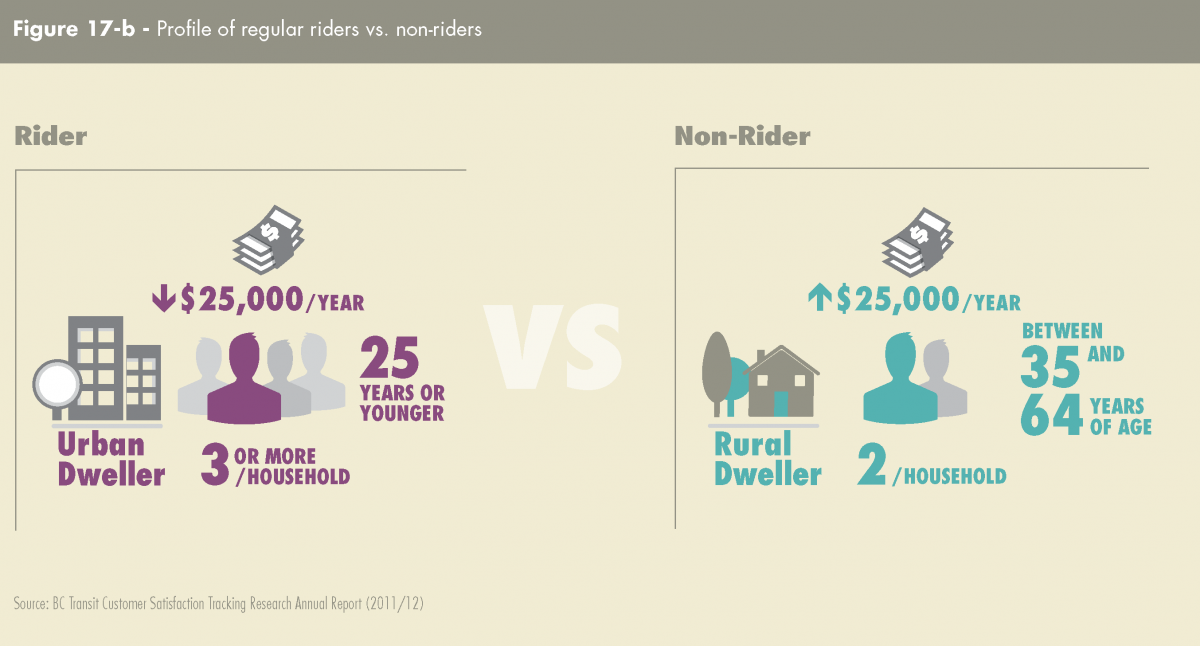
Figure 17-b - Profile of regular riders vs. non-riders (click image to enlarge)