A key performance indicator for BC Transit is ridership levels in each municipality. Combined, they total approximately 50 million rides per year in the province.
In 2008, BC Transit projected that it would achieve the goals of the Provincial Transit Plan for ridership and mode share by 2020. Across the province, they calculated that this would mean an average annual ridership growth of 5 percent– although the expectation was that growth would not be linear. It was expected that new transit initiatives, such as rapid transit, would lead to spikes in ridership. These were not explicitly modelled in the projections, because of lack of certainty regarding when new initiatives would be complete.
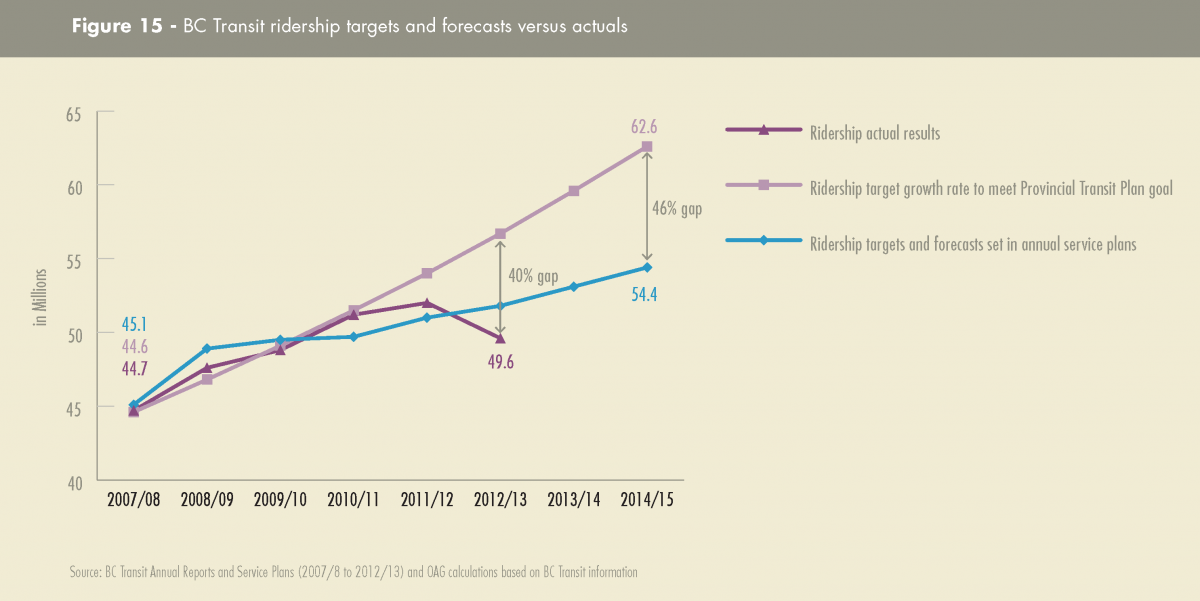
In 2012, the Office of the Auditor General completed an Audit of BC Transit's Ridership Growth Since the Launch of the 2008 Provincial Transit Plan. We found that BC Transit’s ridership growth during this period was 27 percent lower than it projected needing to meet the Provincial Transit Plan target by 2020.
In 2012/13 there was a drop in ridership, which BC Transit attributes to service reductions in a number of communities across the province, as well as a labour disruption in Victoria during the last half of the year. This translated to BC Transit’s ridership growth being 40 percent lower than it projected needing to meet the Provincial Transit Plan target by 2020. Moving forward, BC Transit has adjusted their forecasts to anticipate a lower growth trend for the next three years, leaving a gap of 46 percent by 2015.
Figure 15 - BC Transit ridership targets and forecasts versus actual results (click image to enlarge)
Given the lower forecast for ridership, BC Transit will be challenged to meet the 2020 milestone. As a consequence, it will also take longer to realize the sustainability outcomes associated with a mode share shift from automobile to transit.
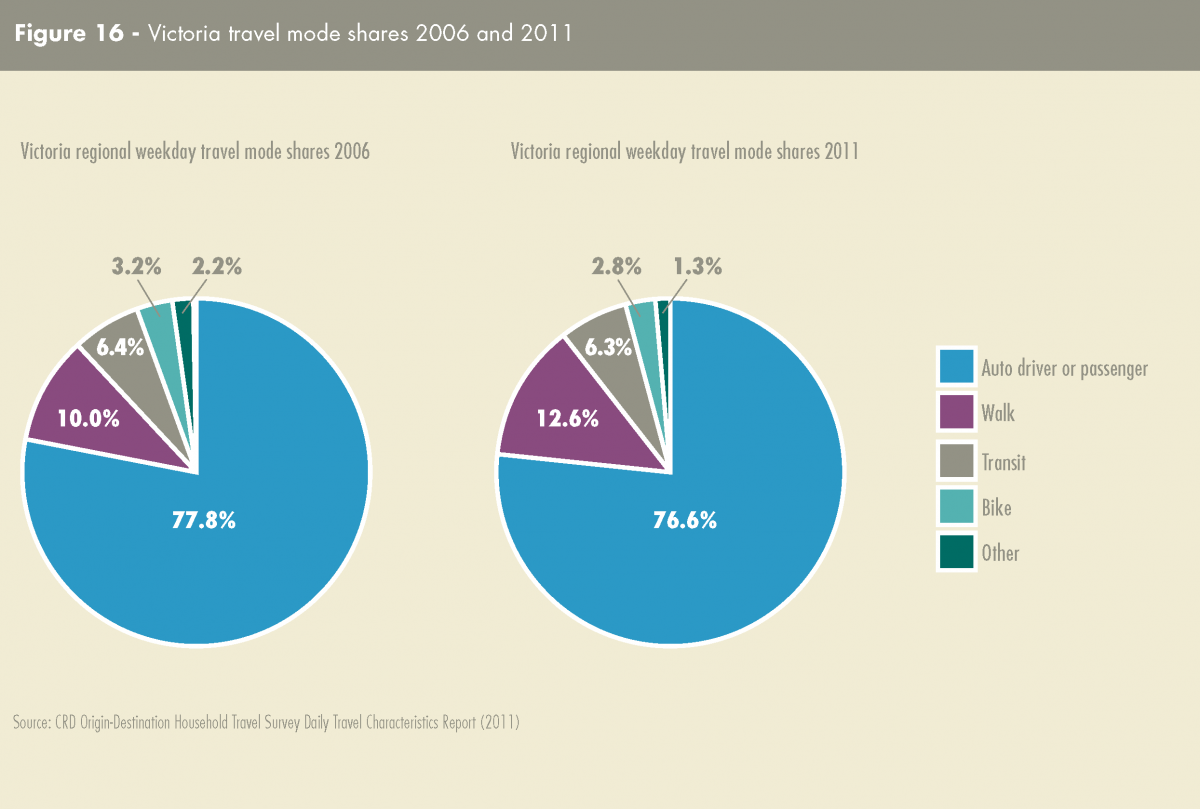
While BC Transit is not measuring mode share, the Capital Regional District’s travel survey results show that there was a slight decrease in transit riders between the last survey in 2006 and the most recent one in 2011. Nonetheless, there was an increase in sustainable transportation modes overall, due to an increase in walking, which led to a slight decrease in automobile use.
Figure 16 - Victoria travel mode shares 2006 and 2011 (click image to enlarge)


